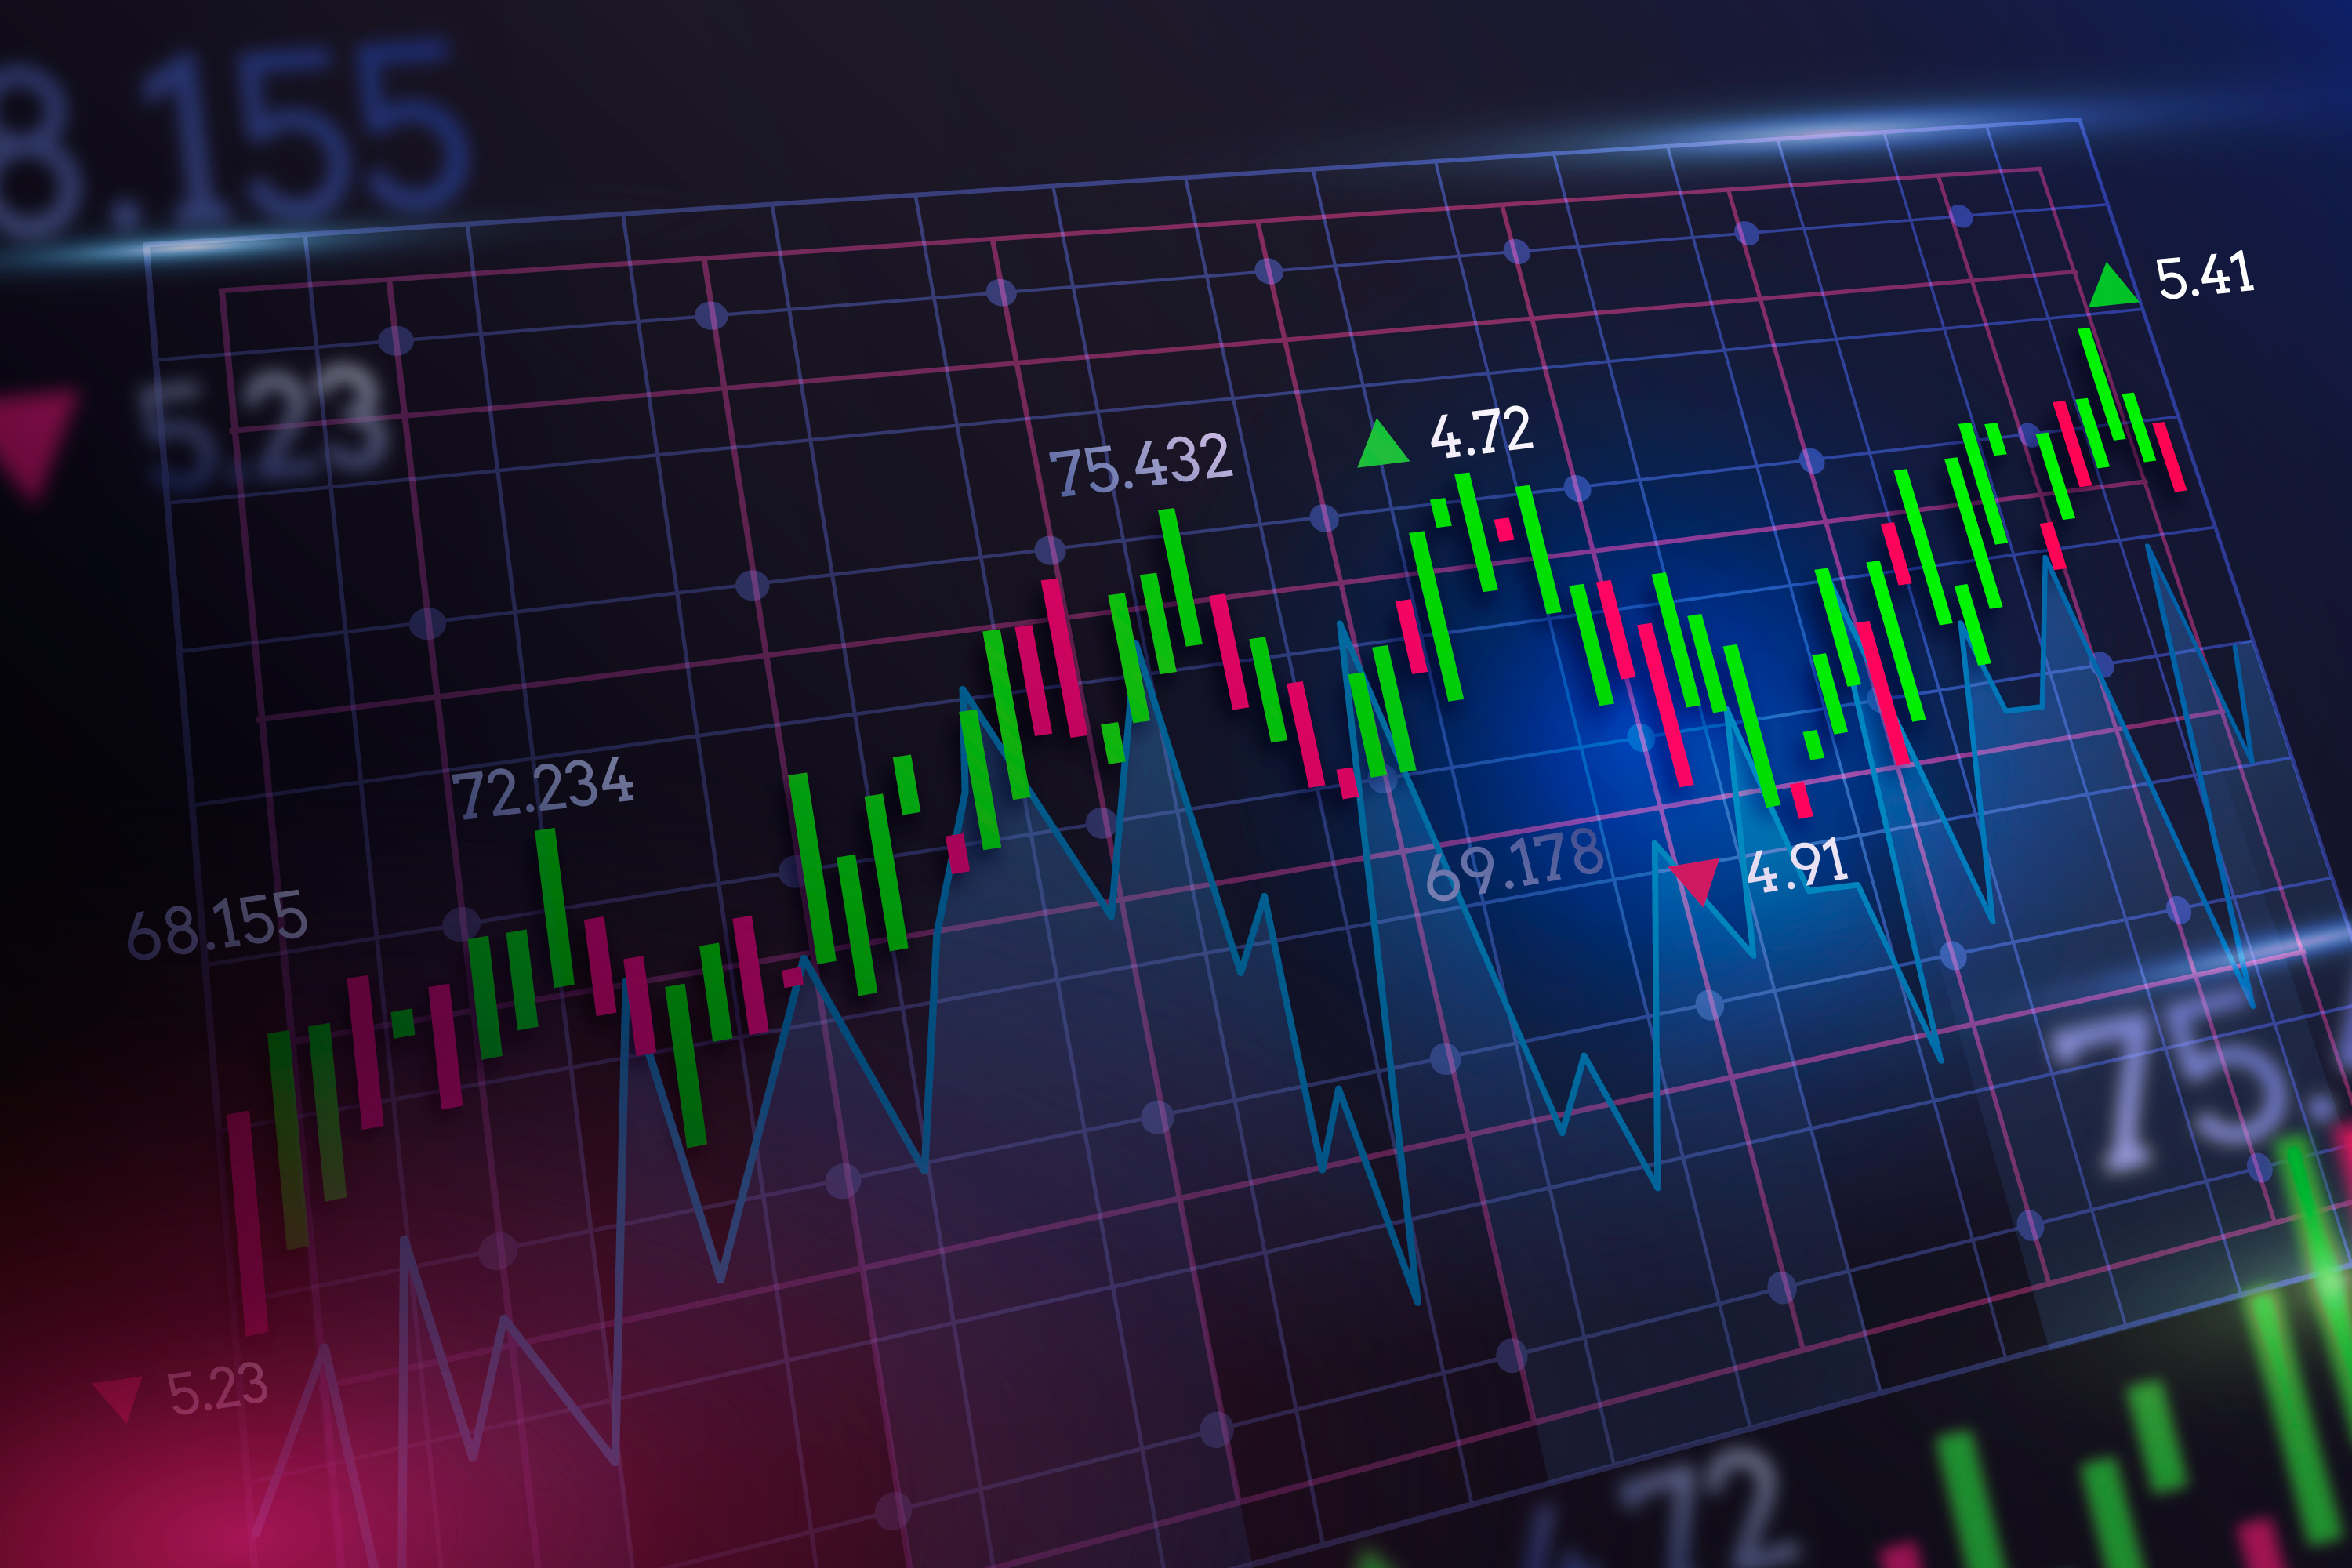
Technical Analysis
Technical analysis is the study of price charts, market trends, volume, and indicators to predict future price movements in stocks, forex, commodities, and crypto markets.
<br>
<h3>1. Principles of Technical Analysis</h3>
<table border="1" cellpadding="12" cellspacing="0" width="100%">
<thead>
<tr>
<th>Principle</th>
<th>Description</th>
</tr>
</thead>
<tbody>
<tr>
<td>Price Discounts Everything</td>
<td>All information is reflected in price.</td>
</tr>
<tr>
<td>Price Moves in Trends</td>
<td>Markets move in trends until reversal.</td>
</tr>
<tr>
<td>History Repeats Itself</td>
<td>Patterns repeat due to market psychology.</td>
</tr>
</tbody>
</table>
<br><br>
<h3>2. Market Trends</h3>
<table border="1" cellpadding="12" cellspacing="0" width="100%">
<thead>
<tr>
<th>Trend</th>
<th>Meaning</th>
</tr>
</thead>
<tbody>
<tr>
<td>Uptrend</td>
<td>Higher highs and higher lows</td>
</tr>
<tr>
<td>Downtrend</td>
<td>Lower highs and lower lows</td>
</tr>
<tr>
<td>Sideways</td>
<td>Range-bound movement</td>
</tr>
</tbody>
</table>
<br><br>
<h3>3. Candlestick Basics</h3>
<table border="1" cellpadding="12" cellspacing="0" width="100%">
<thead>
<tr>
<th>Pattern</th>
<th>Signal</th>
</tr>
</thead>
<tbody>
<tr>
<td>Bullish Candle</td>
<td>Strong buyers</td>
</tr>
<tr>
<td>Bearish Candle</td>
<td>Strong sellers</td>
</tr>
<tr>
<td>Doji</td>
<td>Market indecision</td>
</tr>
<tr>
<td>Hammer</td>
<td>Possible bullish reversal</td>
</tr>
<tr>
<td>Engulfing</td>
<td>Strong reversal pattern</td>
</tr>
</tbody>
</table>
<br><br>
<h3>4. Support and Resistance</h3>
<p>
Support is a price level where buying interest may increase.
Resistance is a price level where selling pressure may increase.
</p>
<br>
<h3>5. Important Indicators</h3>
<table border="1" cellpadding="12" cellspacing="0" width="100%">
<thead>
<tr>
<th>Indicator</th>
<th>Purpose</th>
</tr>
</thead>
<tbody>
<tr>
<td>RSI</td>
<td>Overbought & oversold levels</td>
</tr>
<tr>
<td>MACD</td>
<td>Trend and momentum</td>
</tr>
<tr>
<td>Bollinger Bands</td>
<td>Volatility measurement</td>
</tr>
<tr>
<td>VWAP</td>
<td>Intraday average price</td>
</tr>
<tr>
<td>Moving Average</td>
<td>Trend direction</td>
</tr>
</tbody>
</table>
<br><br>
<h3>6. Chart Patterns</h3>
<h4>Bullish Patterns</h4>
<ul>
<li>Cup & Handle</li>
<li>Double Bottom</li>
<li>Ascending Triangle</li>
</ul>
<h4>Bearish Patterns</h4>
<ul>
<li>Head & Shoulders</li>
<li>Double Top</li>
<li>Descending Triangle</li>
</ul>
<br>
<h3>7. Risk Management</h3>
<ul>
<li>Risk only 1–2% capital per trade</li>
<li>Always use stop loss</li>
<li>Maintain proper risk-reward ratio</li>
<li>Avoid emotional trading</li>
</ul>
<br>
<h3>8. Best Timeframes</h3>
<table border="1" cellpadding="12" cellspacing="0" width="100%">
<thead>
<tr>
<th>Trading Style</th>
<th>Timeframe</th>
</tr>
</thead>
<tbody>
<tr>
<td>Scalping</td>
<td>1m – 5m</td>
</tr>
<tr>
<td>Intraday</td>
<td>5m – 15m</td>
</tr>
<tr>
<td>Swing Trading</td>
<td>1H – 1D</td>
</tr>
<tr>
<td>Positional Trading</td>
<td>Daily – Weekly</td>
</tr>
</tbody>
</table>
<br><br>
<h3>9. Common Beginner Mistakes</h3>
<ul>
<li>Overtrading</li>
<li>Trading without stop loss</li>
<li>Emotional decisions</li>
<li>Ignoring trend direction</li>
<li>Lack of discipline</li>
</ul>
<br>
<h3>10. Conclusion</h3>
<p>
Technical analysis helps traders understand market behavior through charts and indicators. Consistency, discipline, and proper risk management are key to becoming a successful trader.
</p>
What you will learn
-
Principles of technical analysis and chart reading
-
Market trends: uptrend, downtrend, and sideways movements
-
Candlestick patterns and their meanings
Key concepts
Chart patterns
Trading indicators
Price trends